Three-minute setup
Send your logs to FlexLogs.
Charts load before your coffee cools.
checkout.error_rate
WHY TEAMS USE FLEXLOGS
Send your logs to FlexLogs.
Charts load before your coffee cools.
Uses the app logs you already emit.
No new installs or patches required.
Free up to 5 k events/month.
Then just $29/mo to 50 k.
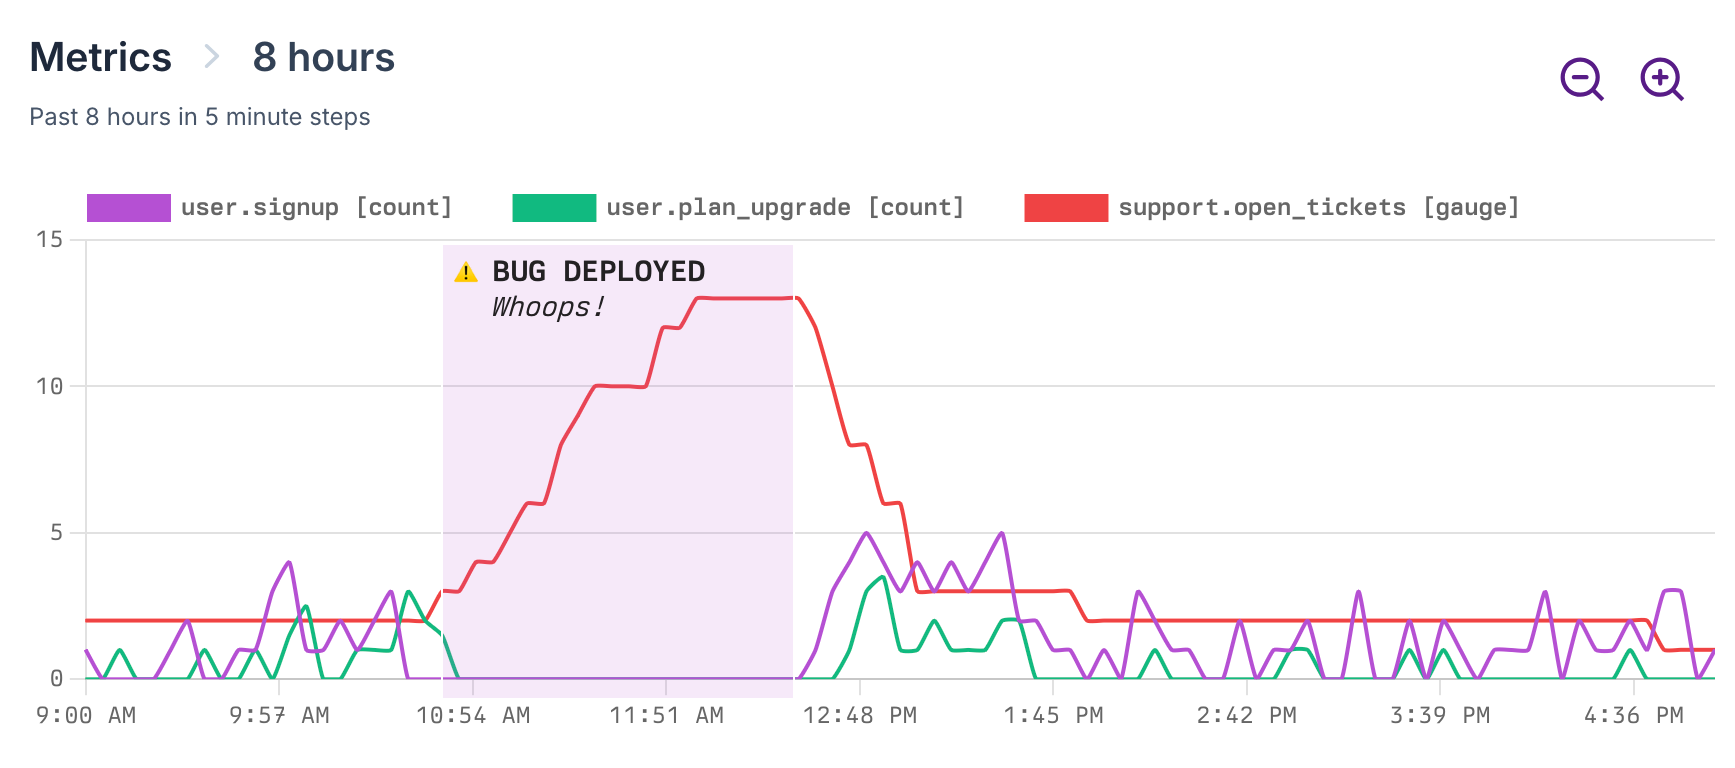
SEE IT IN ACTION
Example metrics: user.signup, user.plan_upgrade, support.open_tickets
WHAT FOUNDERS SAY

“Full-fledged observability tools are fine when you need them, but we needed a handful of key business metrics. FlexLogs gave us exactly that without the baggage.”
— TJ, Founder @ ClearUsage
QUICK START
heroku drains:add \
  https://intake.flexlogs.com/heroku/v1/[API_KEY]
heroku drains:add https://intake.flexlogs.com/heroku/v1/[API_KEY]
curl -X POST \
  https://intake.flexlogs.com/http/v1/[API_KEY] \
  -d "flexlogs{metric: 'curl.request'}"
curl -X POST https://intake.flexlogs.com/http/v1/[API_KEY] \
  -d "flexlogs{metric: 'curl.request'}"
HOW WE STACK UP
| What matters | FlexLogs | Prometheus / New Relic |
|---|---|---|
| Time to first graph | Under 3 minutes. Point logs, open dashboard. | 1–3 hours+ install agents, wire dashboards. |
| Agents & sidecars | None. Logs are the payload. | Mandatory daemons/sidecars to ship metrics. |
| Cost to get started | Free to 5k events; $29/mo covers most apps. | “Free” tier → host/GB pricing snowballs; contracts. |
| Business-metric focus |
Built-in. Treat signup.count like first-class data.
|
Infra-first; business metrics are DIY. |
| Query language | Plain filters, click-to-graph. No DSL to learn. | PromQL, NRQL, etc. plus alert syntax. |
Suites are perfect for deep-dive infrastructure observability once they are installed and configured.
FlexLogs gets you business insight today with the logs you already ship.
SIMPLE PRICING
Only tagged events count toward quota. Everything else is ingested for free.
* Need more than 5M tagged events?
Let’s chat.
† Heartbeat monitors alert you when a ping is overdue.
PLUGS IN EVERYWHERE


READY TO SEE IT LIVE?
Hook FlexLogs to your existing drain, tag one event, and watch live charts appear before your deploy finishes.
Ship my first metric →