Healthchecks

Healthchecks monitor critical parts of your application. Healthchecks work by making an HTTP(s) call to a URL you define to make sure it's alive, like checking for a heartbeat. We'll let you know if it's down, and you can respond with JSON to create metrics, messages, or heartbeats.
Typical healthcheck services ping your application and ensure it responds. FlexLogs Healthchecks do this too, but also take it a step further. We'll ping your application to make sure it's alive, but also create metrics or perform other useful tasks based on your response.
Imagine you want to monitor the length of a background queue every minute or keep an eye on your current MRR every hour. That's easy - just respond to the periodic Healthcheck with that data.
Getting Started with Healthchecks
Head over to your FlexLogs dashboard and click on the "Healthchecks" tab and create a new Healthcheck with the "New Healthcheck" button.
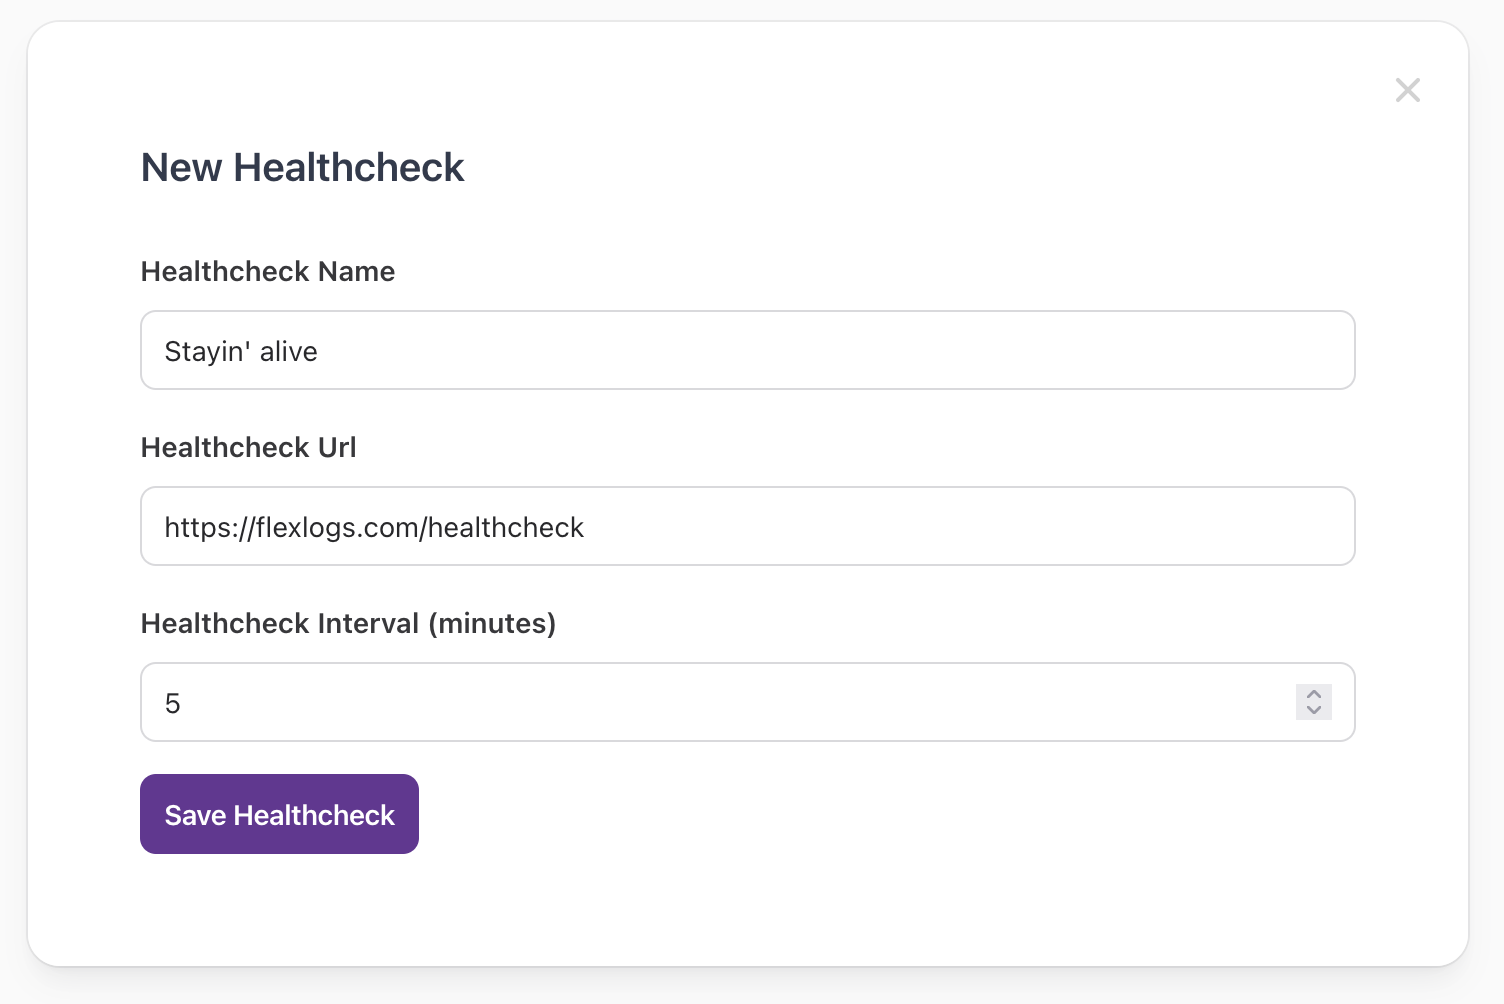
After you create a new Healthcheck, FlexLogs will start to ping the URL.
Responding with JSON
If you want to do more with Healthchecks, you can respond with some data.
Your JSON response will be parsed with the same rules as logs, so your response can create metrics, messages, or heartbeats (I'm not sure why you would want to create a heartbeat this way though).
You do not need to respond with data if you just want to make sure it's alive, but it can be useful if you want to create metrics or perform other actions.
Events created by Healthchecks will show up in the project's Events tab,
learn more about Events
.
    // example JSON resoonse that would create (or update) a metric
    {"metric": "healthcheck.ping"}

    // example response to update an observation metric
    {"metric": "queue_length", "type": "observation", "value": 100}

    // respond with more than one if you'd like
    [
     {"metric": "healthcheck.ping"},
     {"metric": "queue_length", "type": "observation", "value": 100}
    ]
Note - the response is good old-fashioned JSON, don't use the "flexlogs{...}" wrapper like that shown in Metrics since we don't need to separate it from other logs.
For more options and examples of what you could include in your response, see the Metrics or Messaging documentation.